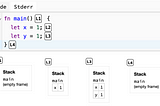
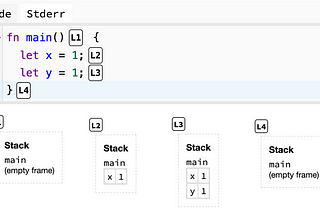
UrvashiExplained: Ownership in RustIf you’re someone who works mostly with either Java, Python or JavaScript, then you’re already familiar with garbage collected languages.4d ago4d ago
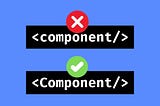
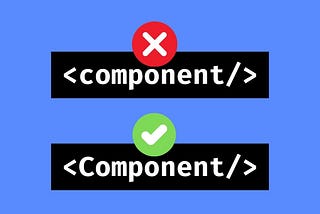
UrvashiWhy React Component Names Must Begin With A Capital Letter?One of the first things you learn about in React is components.Feb 21Feb 21
UrvashiHow to Create QR Code Art using Stable DiffusionA few days back, a user on Reddit shared these images:Jun 18, 20232Jun 18, 20232
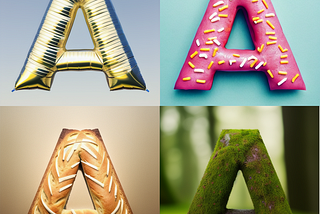
UrvashiHow to Generate Firefly-like Text Effects in Stable DiffusionA few days ago, Adobe made an exciting announcement that there’s no longer a waitlist for trying out its generative AI Firefly. If you have…May 30, 2023May 30, 2023
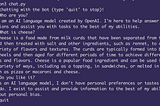
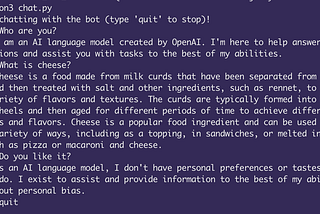
UrvashiHow to Build your own custom ChatGPT Using Python & OpenAIIf you want to build a chat bot like ChatGPT or BingChat, then you’re in the right place!May 29, 20232May 29, 20232
UrvashiGetting Started with OpenAI API in JavaScriptHey there 👋 In this post, we’ll be learning how to use the OpenAI API in JavaScript to build powerful apps that can understand and…May 28, 20232May 28, 20232
UrvashiThe Beginners Guide to Setting Up a Gatsby BlogToday we will be creating a blog with Gatsby and deploying it on Netlify. For the purposes of this blog, we will be using a Gatsby starter…Nov 28, 20201Nov 28, 20201
Urvashi10 Things to Learn about Web Usability from ‘Don’t Make Me Think’Recently, I finished reading the book ‘Don’t Make Me Think’ by Steve Krug. Here are a few things I learned about Web Usability.Nov 21, 2020Nov 21, 2020
UrvashiReact + d3: Implementing a Pie ChartIn the last post, we talked about implementing a simple line chart with tooltips using d3.js and React. Today, we will be looking into how…Oct 10, 20202Oct 10, 20202
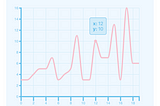
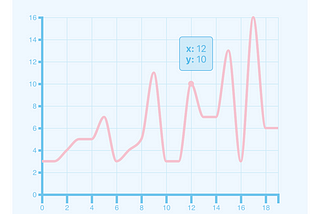
UrvashiinBetter ProgrammingPlotting a Line Chart With Tooltips Using React and D3.jsCreate stunning data visualizations in your app todayOct 1, 2020Oct 1, 2020